ZetaView® | Nanoparticle Tracking Analysis Instrument

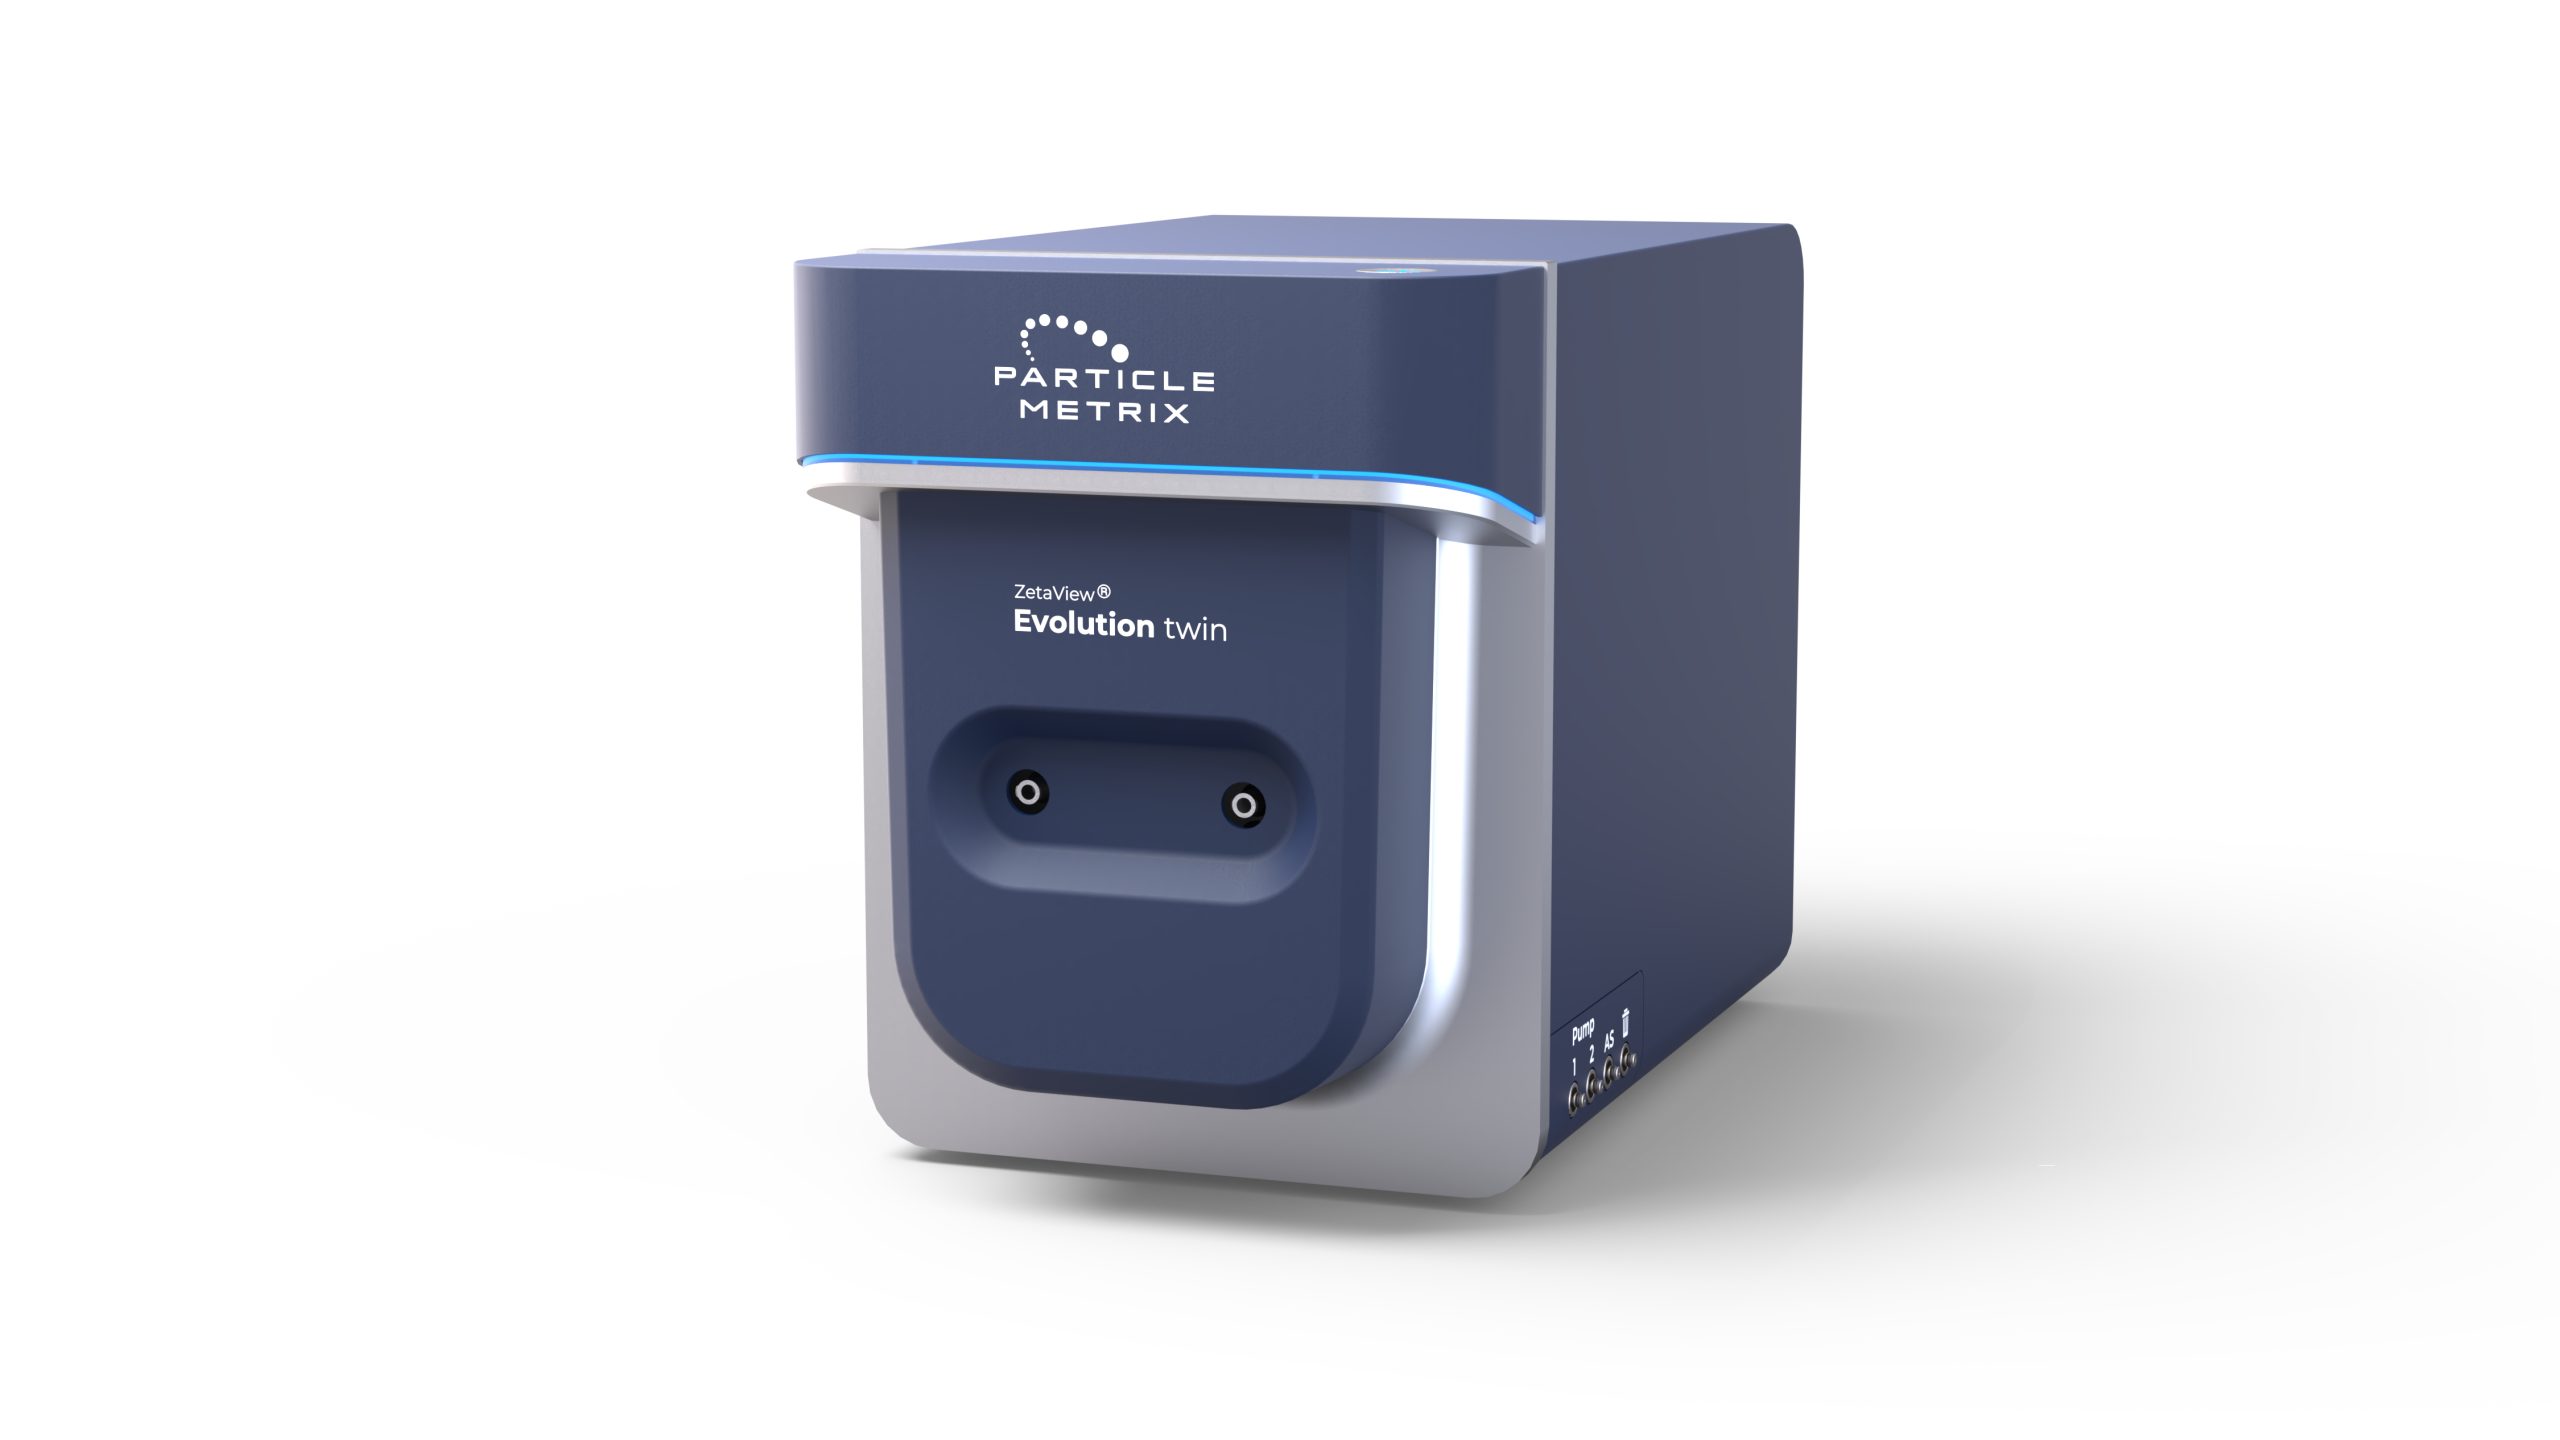
The ZetaView® is a unique Nanoparticle Tracking Analysis (NTA) instrument for measuring hydrodynamic particle size, zeta potential, concentration, fluorescence and colocalization

Key Features:

  • Scanning NTA – automated measurements are taken at 11 positions through the sample cell, providing a robust interrogation of samples with powerful statistics, without need for additional accessories.
  • Fixed cell assembly design – allowing easy cleaning with no disassembly required.
  • Increased fluorescence capabilities – a 12- position filter wheel increases the extent to which fluorescently labelled biomarkers can be analysed in one sample.
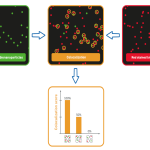
  • Colocalization –visualisation of colocalized nanoparticles offers the unique ability for NTA to produce data on the percentage of colocalization within a single sample measurement.
  • Auto-alignment & auto-focus – the optical setup is automatically optimized by the software, saving the user time preparing the instrument for use and removing subjective user input bias.
  • Sample recovery – The sample recovery port allows full recovery analysed samples without cross contamination with cleaning buffer.
  • Fast measurements –  The latest software allows for even faster analysis. Over 2,000 particles can be analysed in as little as 60 seconds.
  • Quick and simple cleaning – cleaning between samples requires only a quick flush. The new fixed cell design allows very quick access to the measuring cell with a bayonet lock.

As exclusive distributor for the UK and Ireland, Analytik is proud to supply the Zetaview® from Particle Metrix. Through Analytik, you’ll have access to our team of experts to help develop your application and get the most out of your investment.

For more information, or to discuss your requirements with a product specialist, please call us on +44 (0)1954 232 776 or email info@analytik.co.uk.

Description

ZetaView® Next Generation Nanoparticle Tracking Analyser

ZetaView® is well-established as a unique NTA instrument for EV research. Measuring hydrodynamic particle size, zeta potential, concentration, fluorescence and colocalization, it offers many key benefits over other NTA instruments including ease of use and cleaning, faster measurements, and no requirement for ongoing high-cost consumables.

With a new permanently installed cell assembly with special NTA flow cell to further improve ease of use and cleaning, Particle Metrix have gone a step further in developing the only NTA system in the world that makes it possible to detect two different fluorescence signals within the same, single particle on non-immobilized samples (called colocalization).

Nanoparticle Tracking Analysis with the ZetaView® 
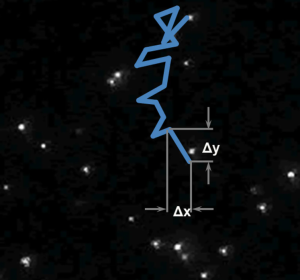
With nanoparticle tracking analysis, you measure what you see. Each individual particle in the field of view is counted and tracked in short video clips, creating accurate concentration calculations and particle size distributions. The ZetaView® combines these measurements with classical micro-electrophoresis, for determination of zeta-potential. All of these parameters can be measured both in scattering mode and in fluorescence mode, for determination of fluorescently-labelled sub-populations. The result is one compact instrument capable of measuring size, concentration, zeta-potential and fluorescence.

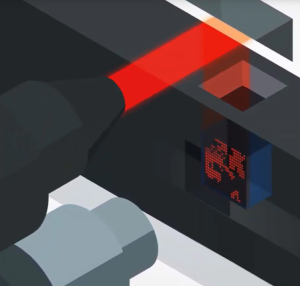
The main advantage of the ZetaView® system is that the optical setup can be moved. The laser and microscope objective can be moved both synchronously and independently.Optical Layout of the automated particle tracking ZetaView® Laser Light Scattering unit

  • Moving the laser and objective synchronously allows sub-volume scanning of the sample cell. Measurements can be taken at 11 different positions across the cell, meaning measurements are based on having tracked thousands of individual particles, giving a more representative analysis than single-point measurements, and adding more power to the statistical analyses.
  • Moving the optics independently allows the system to automatically align the laser and objective, therefore automatically focussing the image of the particles and significantly minimising setup time. Once the focussing is done, there is no need to repeat the procedure for the rest of the day.

qualityZeta Potential

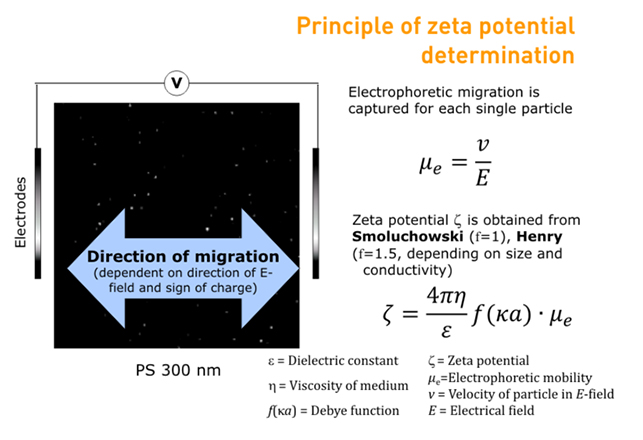
Zeta potential is effectively a measure of the surface charge of a particle and the ZetaView® uses micro-electrophoresis to calculate it.

The zeta potential distribution is calculated from the electrophoretic mobility results at the two stationary layers in the sample cell, or from an electrokinetic velocity profile obtained by scanning at all 11 positions throughout the sample cell.

The zeta-potential is calculated from the Smoluchowski or Henry equation – see the “Theory” tab, above. In addition to the particle zeta potential result, the curvature of a profile delivers information on the polarity and amount of ionic coating on the cell walls.

Zeta Potential Distributions

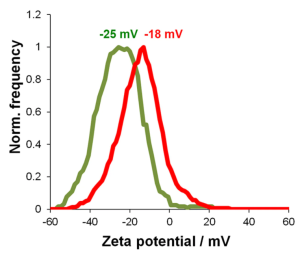
The below example highlights the capability of the ZetaView® and zeta potential, as well as the importance of measuring zeta potential and its relationship with hydrodynamic particle size.A: dispersed in 2 mM KCl solution (stable). B: dispersed in distilled water (unstable)

A 60 nm gold dispersion was studied for size and zeta potential distribution (pictures on the right). The sample is slightly bi-modal.

Curve A (red) represents gold particles in a 2m KCl environment, curve B (blue/green) the same sample but dispersed in distilled water.

The zeta potential distribution of curve B shows a peak near 0 mV, which is making the suspension unstable, due to a lack of repulsive force between the particles (no charge). The majority of the 60 nm particles are therefore agglomerated, which is clearly seen in the size distribution of curve B.

ZetaView and Fluorescence (F-NTA)
fluorescence

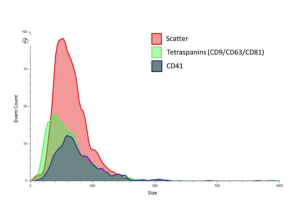
With NTA, particles are viewed by detection of the light that they scatter. Due to the physical nature of this detection method, a chemical discrimination is not provided. In order to add specificity to particle characterisation, Fluorescent Nanoparticle Tracking Analysis (F-NTA) can be employed.

Nanoparticle such as vesicles can be labelled with a specific antibody bearing a fluorescent molecule (fluorophore). The ZetaView® is fitted with a slide-in filter to block scattered light from the laser, allowing past only fluorescence of a longer wavelength, generated by excitation of the fluorophores by the laser. Therefore, only the fluorescently-labelled particles will be detected and measured by the camera.

Multi-Fluorescence Nanoparticle Tracking Analysers

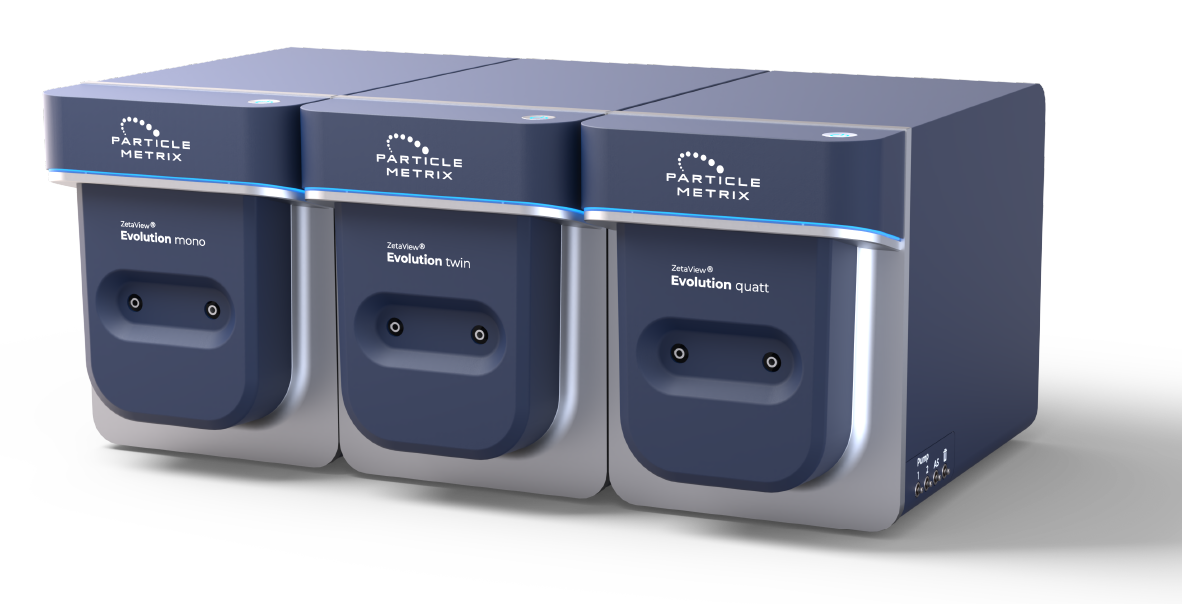
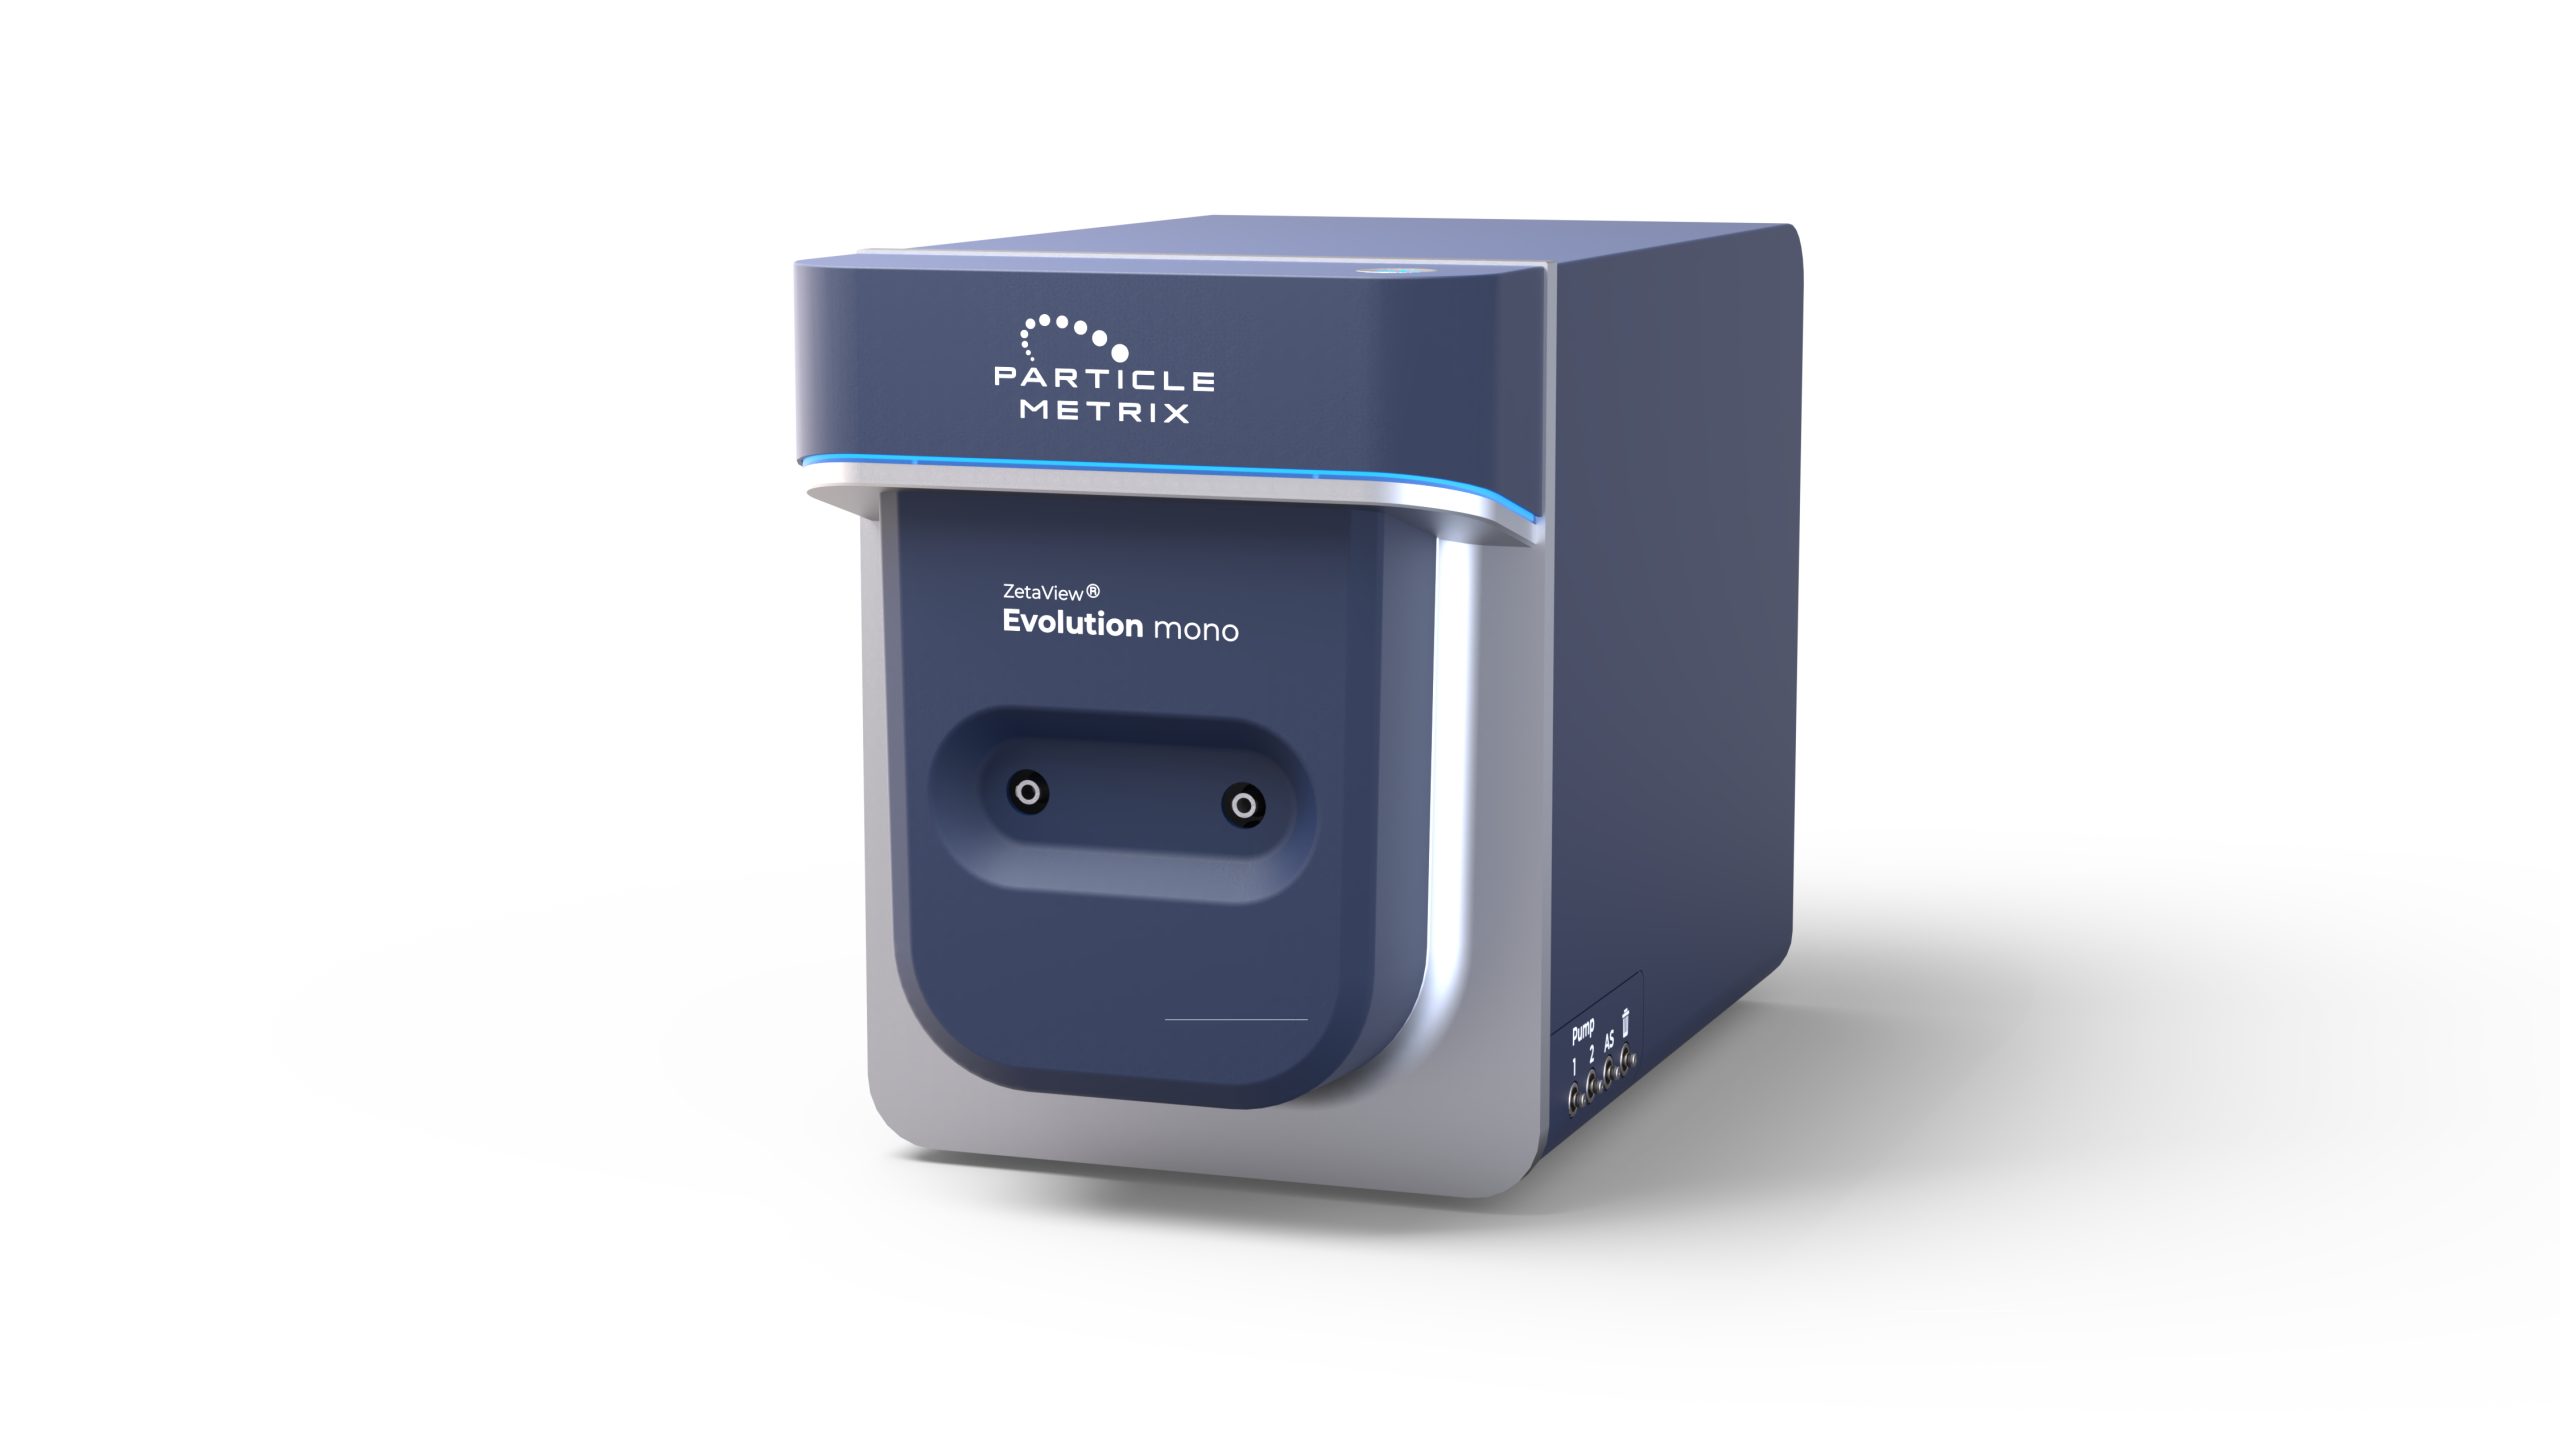
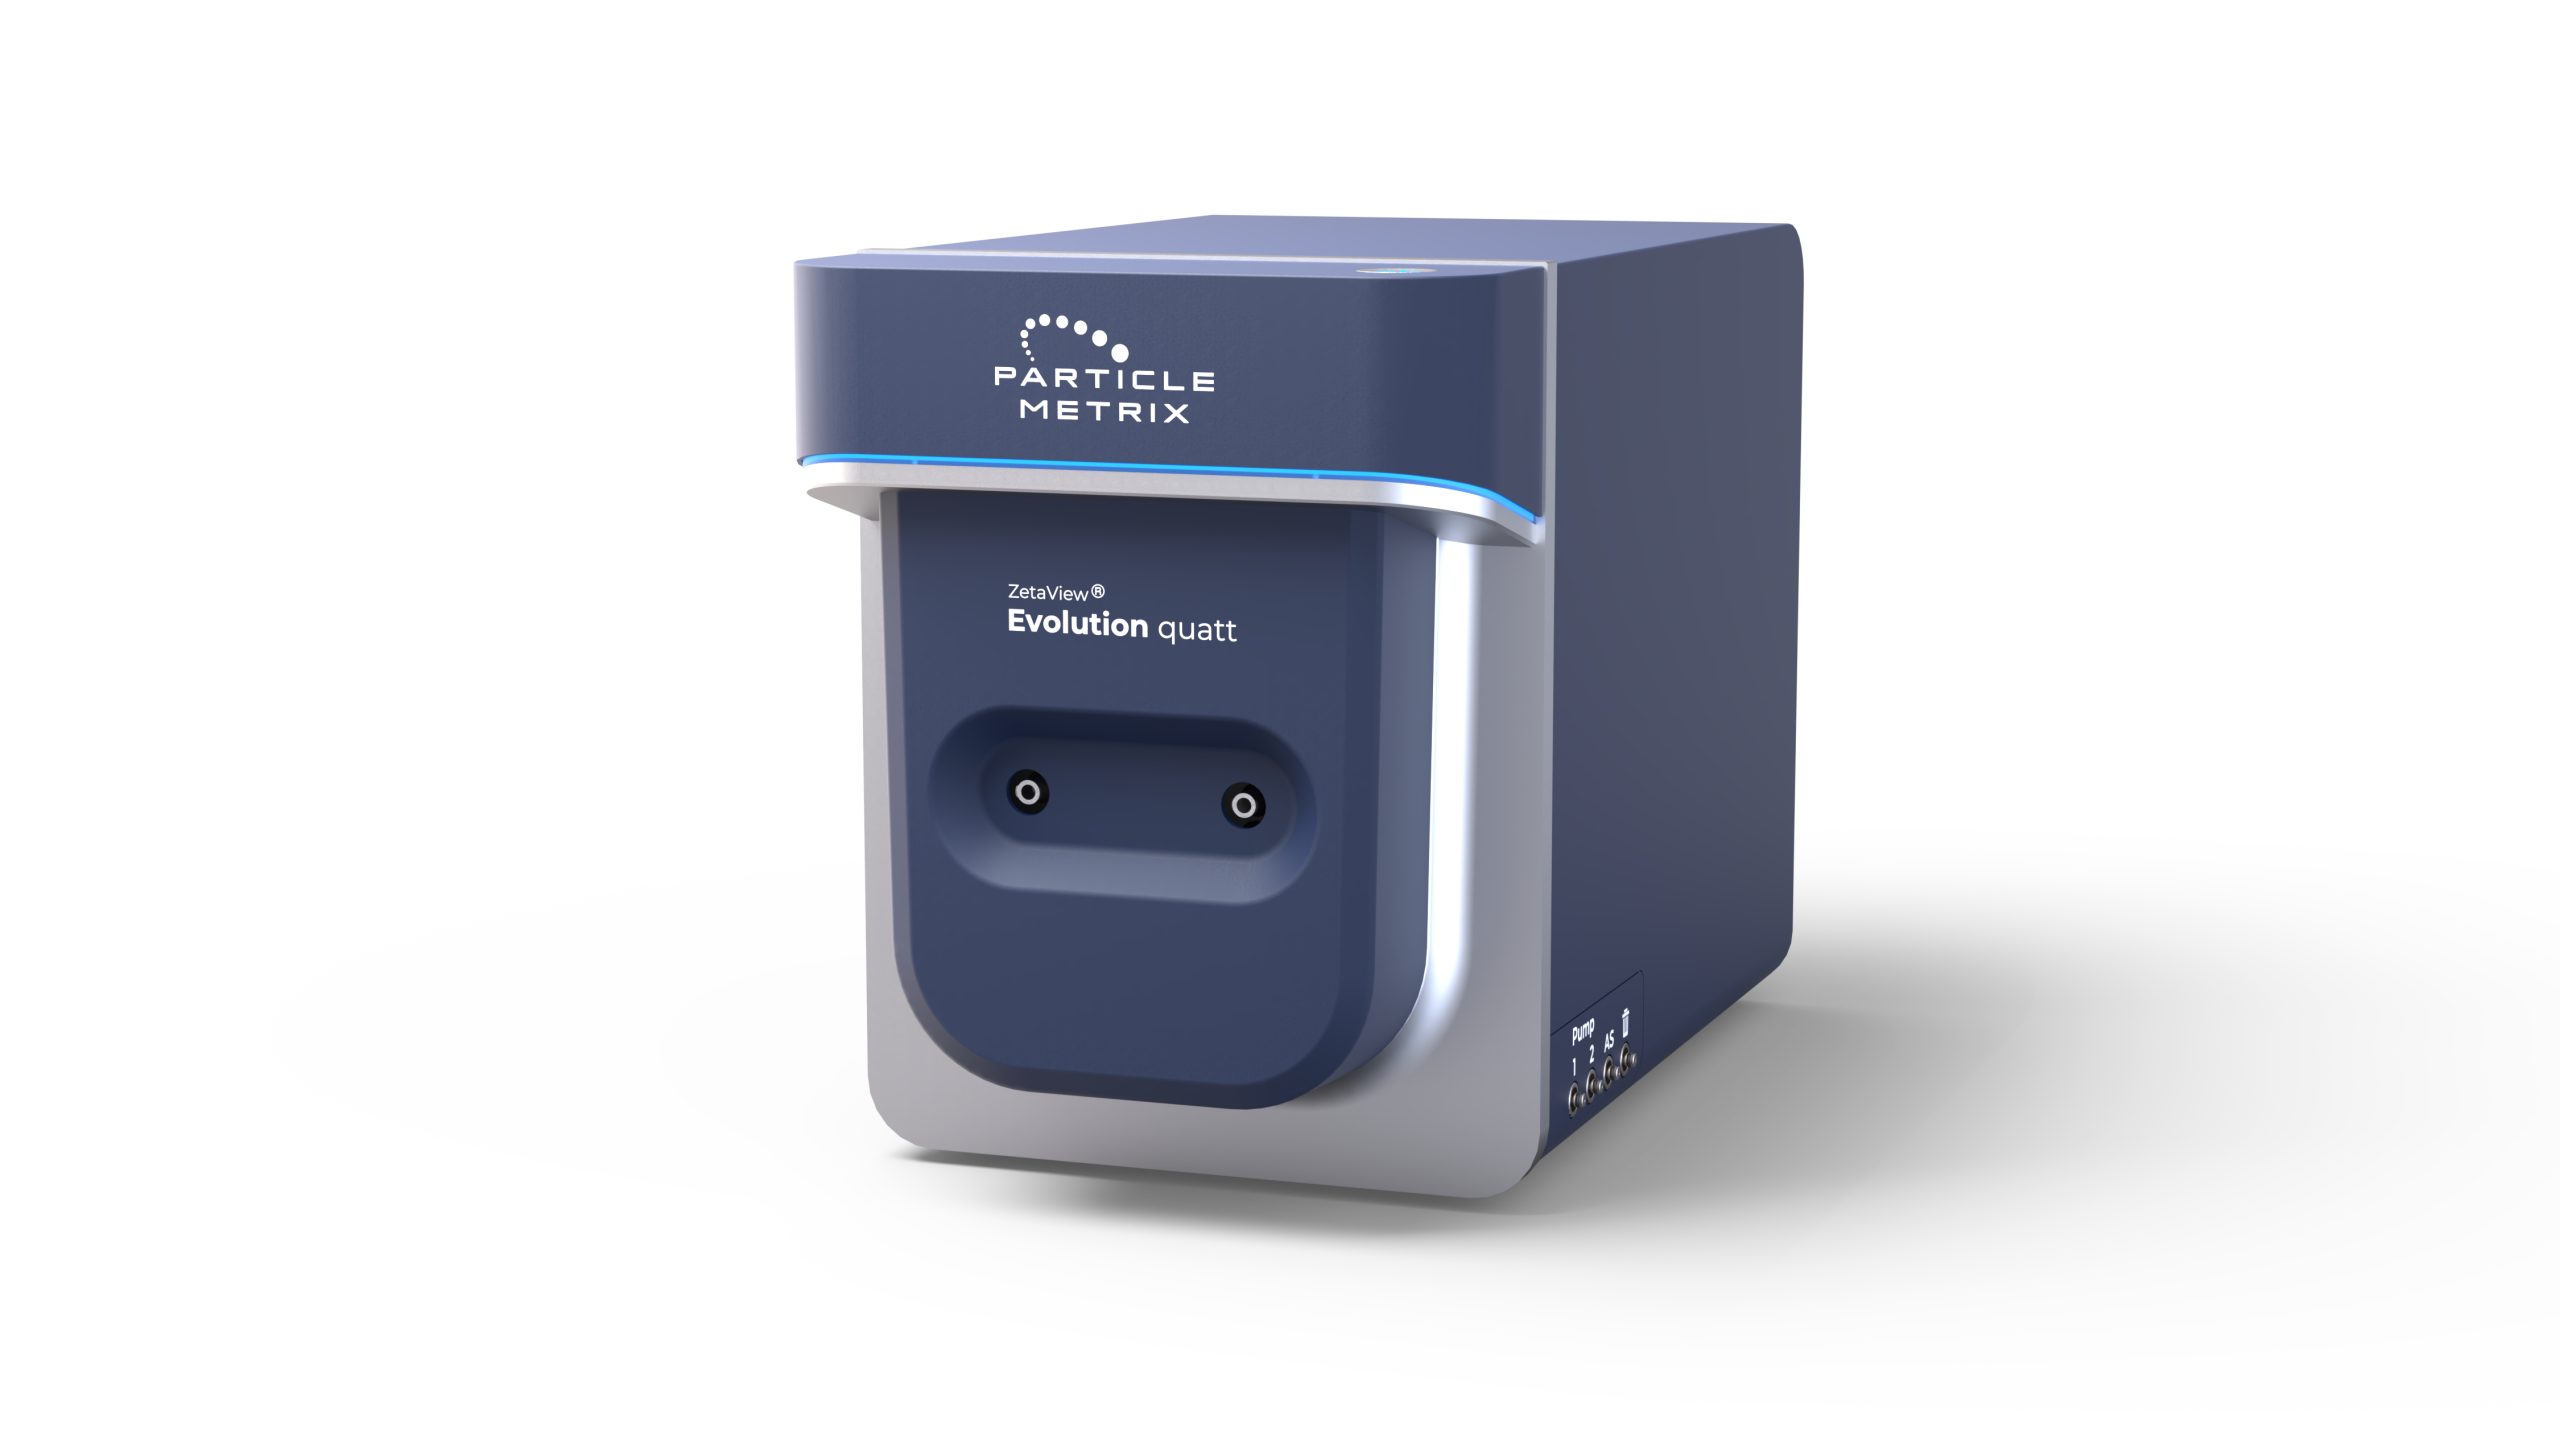
The system is available as a single laser (MONO), two laser (TWIN) and a four laser (QUATT) model, giving users a choice of up to four excitation wavelengths for fluorescent labelling. A 12 -position filter wheel can also be utilised therefore, up to eleven different fluorophores can be used on the same sample to identify different sub-populations. The mono laser system offers the convenient ability to later upgrade to a twin or a four-laser system, with colocalization capability.

Interested in the Zetaview®? Request a quote or call us on +44(0)1954 232 776 to discuss your requirements.

Theory

Particle SizeParticle size by Brownian motion: Nanoparticle Tracking Analysis (NTA)

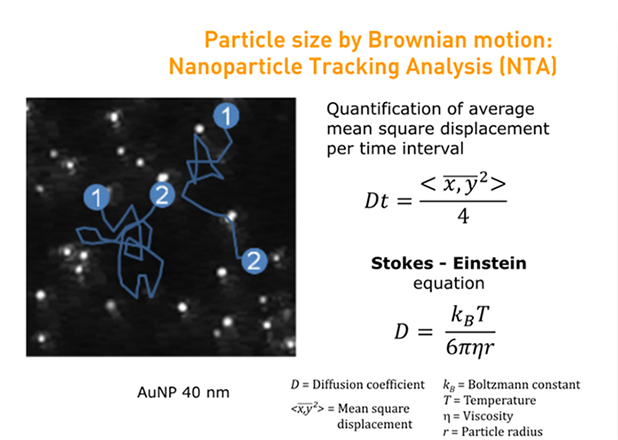
Calculation of hydrodynamic particle size is achieved by analysis of short video clips of particles moving in a liquid under Brownian Motion.

Brownian Motion is the random movement of particles in a liquid caused by constant collisions with the fast-moving molecules of the containing liquid.

The ZetaView® software analyses video clips to calculate the mean square displacement. The Stokes-Einstein equation is then applied to calculate hydrodynamic particle size, as shown in the graphic, right.


Zeta PotentialPrinciple of zeta potential determination

The ZetaView® uses micro-electrophoresis in order to calculate zeta potential.

An electric field is applied across the sample cell and short video clips are taken of the particles moving through the cell according to their surface charge and polarity.

The ZetaView® software then analyses the video clips to determine electrophoretic mobility. The Henry/Smoluchowski equation is then applied in order to calculate zeta potential, as shown in the graphic, right.

Colocalization 

ZetaView® combines the precision of new generation lasers for perfect illumination of NTA channels and very short switching times with smart software – indispensable prerequisites for the challenging task of the quantification of biomarker colocalization scores.

Applications

  • Extracellular Vesicles (EV) and Exosomes
  • Bio-nanoparticles
  • Liposomes and Micelles
  • Drug Delivery
  • Protein Agglomeration
  • Viruses
  • Virus Like Particles (VLP)
  • Emulsions
  • Polymers
  • Nanometals
  • Nanobubbles
  • Humic Acids
  • Quantum Dots
  • F-lablled Nanoparticles

Videos

The Next Generation ZetaView® Nanoparticle Tracking Analyser

ZetaView® Nanoparticle Tracking Analyser (NTA Instrument)

Explore the Nanocosmos with Particle Metrix´s ZetaView

Nanoparticle Tracking Analysis (NTA) with ZetaView®


Webinars

Multi-Fluorescence NTA – Next Generation EV Characterisation with Particle Metrix ZetaView®

Latest Improvements in Fluorescent Nanoparticle Tracking Analysis


Downloads

PDF Icon ZetaView® Next Gen NTA Brochure

PDF Icon ZetaView® Colocalization Info Sheet

PDF Icon ZetaView® MONO Datasheet

PDF Icon ZetaView® TWIN Datasheet

PDF Icon ZetaView® QUATT Datasheet

PDF Icon ZetaView® Service & Support Brochure

Whitepapers

PDF Icon Introduction to Nanoparticle Tracking Analysis (NTA)

PDF Icon Zeta potential and size measurement of nanoparticles by laser scattering video microscopy

Technical/Application Notes

PDF Icon Phenotyping of EVs by Multi-Wavelength Fluorescence Nanoparticle Tracking Analysis

PDF Icon Three in One: Concentration, Size & Zeta Potential measured on sub-visible protein suspensions

PDF Icon Zeta potential distribution of 1 nm particles

PDF Icon The Scanning Nano Particle Tracking Analysis (NTA) ZetaView™ now for potentially hazardous samples

News & User Stories

News Icon Oxford Brookes University use the Zetaview to study Extracellular Vesicles

News Icon Cell Guidance Systems use the ZetaView for Exosome Research and Quality Control

News Icon University Hospital of Duisburg-Essen uses the ZetaView to quantify Extracellular Vesicles

News Icon University Hospital of Erlangen uses the ZetaView to Quantify Extracellular Vesicles

News Icon The Ottawa Hospital Research Institute uses the ZetaView to study Membrane Microparticles as potential Biomarkers for Underlying Diseases

News Icon An Innovative Method for Exosome Quantification and Size Measurement

News Icon Customer Success Story: OmniSpirant Therapeutics 

How to Videos

Particle Metrix has created a number of “How To” videos to assist with operating and maintenance of your instrument. View the video playlist on YouTube.

Videos include:

ZetaView® – Start-up Routine

ZetaView® – Standard Operation Procedures (SOPs)

ZetaView® – How to avoid air bubbles

ZetaView® – Cleaning the measuring cell

How to analyze a size measurement

Plus many more!

NTA Simulator

Particle Metrix has developed a NTA simulator which enables visualisation of sample measurements with the ZetaView®.

ZetaView NTA Simulator

View the NTA simulator >

    Please complete and submit the form below.

    Name*

    Organisation*

    Email*

    Telephone

    Preferred contact method

    Message*

    CONNECT WITH ANALYTIK!

    Contact Us

    Complete this form to send us an email and we'll get back to you as soon as possible.

    Start typing and press Enter to search