Zeta Potential – Who? What? Why?
What is Zeta Potential?
Zeta Potential is the potential difference across an electrostatic double layer of ions that surround a solid particle dispersed in a polar liquid. In short, it is a measure of the surface charge of a particle.
How do you measure zeta potential?
Zeta Potential can’t be measured directly, but it can be calculated using 3 different methods:
- Electrophoretic mobility
- Streaming Potential
- Colloid Vibration current (ultrasound)
- Electrophoretic Mobility
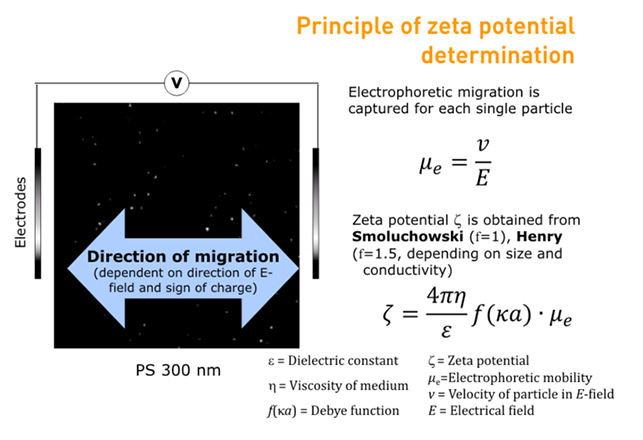
The Particle Metrix ZetaView® uses micro-electrophoresis to calculate zeta potential from electrophoretic mobility. An electric field is applied across the sample cell and short video clips are taken of the particles moving through the cell according to their surface charge and polarity.
The ZetaView® software analyses the video clips to determine electrophoretic mobility, and the Henry/Smoluchowski equation is then applied in order to calculate zeta potential.
Why measure Zeta Potential?
Zeta potential plays a key role in a range of research areas and is linked to the stability of colloidal dispersions. Zeta potential can also be an indicator of self-life in products such as paints and beverages.
Areas where this knowledge may be useful include:
- Extracellular Vesicles (EV) and Exosomes
- Bio-nanoparticles
- Liposomes and Micelles
- Drug Delivery
- Protein Agglomeration
- Viruses
- Virus Like Particles (VLP)
- Emulsions
- Polymers
- Nanometals
- Nanobubbles
- Humic Acids
- Quantum Dots
- F-labelled Nanoparticles
Zeta Potential is only part of the ‘stability picture’. This measure of electrostatic repulsion between particles reacts to pH, conductivity and the polyelectrolyte surrounding. Any of these parameters can cause a material system to shift and change the zeta-potential. With the Stabino, the following information can be obtained, giving a much broader understanding of a colloid or dispersion.
- Iso-electric point
- Established using ph titrations
- Charge density
- Determined using Polyelectrolyte titrations
Example: Zeta Potential Distribution of gold particles in suspension
The below example highlights the importance of measuring zeta potential and its relationship with hydrodynamic particle size.
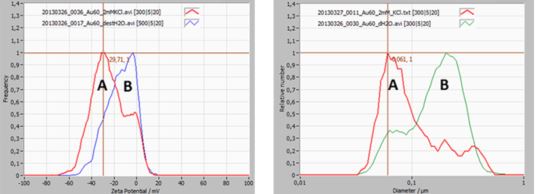
A 60 nm gold dispersion was studied for size and zeta potential distribution (see image below). The sample is slightly bi-modal.
Curve A (red) represents gold particles in a 2m KCl environment, curve B (blue/green) the same sample but dispersed in distilled water.
 The zeta potential distribution of curve B shows a peak near 0 mV, which is making the suspension unstable, due to a lack of repulsive force between the particles (no charge). The majority of the 60 nm particles are therefore agglomerated, which is clearly seen in the size distribution of curve B.
Further reading: Zeta Potential – What is it and how can it be characterised?


